Executive Summary: Flawed Assumptions Lead to Dangerous “Forecasts”
For decades, the International Energy Agency (IEA) was the world’s gold standard for energy information and credible analyses. Following the commitment of its member governments to the 2015 Paris Agreement climate accords, the agency radically changed its mission to become a promoter of an energy transition. In 2022, the IEA’s governing board reinforced its mission to “guide countries as they build net-zero emission energy systems to comply with internationally agreed climate goals.”
The IEA’s current preoccupation with promoting an energy transition has resulted in its signature annual report, the World Energy Outlook (WEO), offering policymakers a view of future possibilities that are, at best, distorted and, at worst, dangerously wrong.
The 2024 WEO’s central conclusion, its core “outlook,” has been widely reported as a credible forecast, i.e., something likely to happen: “[T]he continued progress of transitions means that, by the end of the decade, the global economy can continue to grow without using additional amounts of oil, natural gas or coal.”
The WEO itself states that it doesn’t forecast but has scenarios—explorations or models of possibilities, and cautions: “Our scenario analysis is designed to inform decision makers as they consider options…. [N]one of the scenarios should be viewed as a forecast.” Scenarios that usefully “inform” need to be based on realistic possibilities and assumptions. But there is one foundational assumption—one that the IEA has for decades included in its scenarios and that has been banished from the WEO: the possibility of business as usual (BAU).
Instead, the WEO’s baseline scenario now assumes that nations are undertaking their
specific energy-transition plans that they promised in order to comply with the 2015 Paris Agreement, i.e., “stated policies scenario” (STEPS). Yet none of the signatories to that Agreement is fully meeting its promises, and most are a long way behind schedule. Believing something that is not true is not just problematic; it meets the definition of a delusion.
It is fanciful to forecast that, over the next half-dozen years, the growth in the world’s population and economy won’t continue a two-century-long trend and lead to increased use of the fossil fuels that today supply over 80% of all energy, only slightly below the share seen 50 years ago. The data show that the global energy system is operating essentially along BAU lines and not only far off the STEPS, but even further away from the more aggressive transition aspirations that the WEO also models.
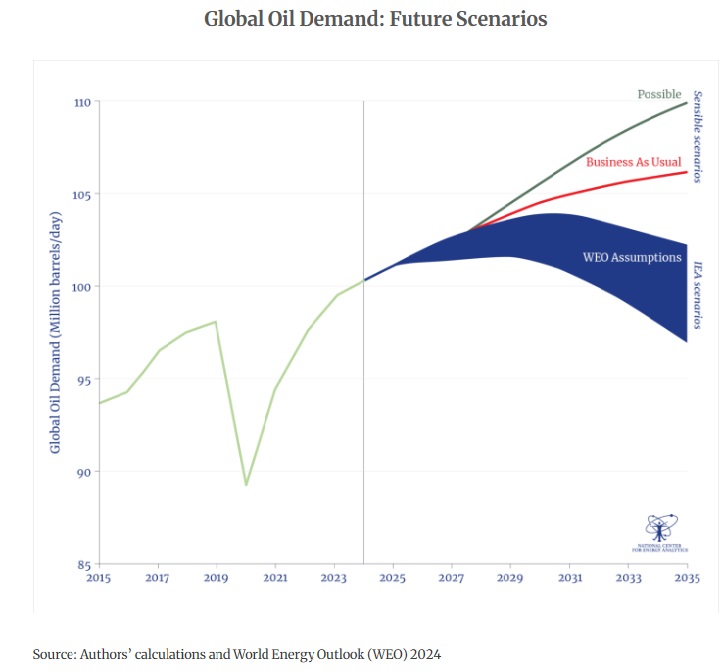
In this analysis, we focus on highlighting 23 problematic, flawed assumptions that are relevant specifically to the WEO’s oil scenarios and the widely reported “forecast” that the world will see peak oil demand by the early 2030s (see box on pp. 4-5, Flawed Assumptions Lead to Flawed Conclusions). While other scenarios about other energy sources are critical as well, oil remains a geopolitical touchstone and the single biggest source of global energy—10-fold greater than wind and solar combined. At the very least, this analysis points to the need for real-world scenarios in general and, in the case of oil, the much higher probability that demand continues to grow in the foreseeable future and, possibly, quite significantly (below, see Global Oil Demand: Future Scenarios).
Debating the intricacies in flawed assumptions about energy scenarios is no mere theoretical exercise. The IEA’s legacy reputation continues to influence not only trillions of dollars in investment decisions but also government policies with far-reaching geopolitical consequences.
Global Oil Demand: Future Scenarios
The promotional aspirations and flawed assumptions underlying IEA’s peak-demand scenarios have serious implications, given the obvious global economic and security considerations in planning for and delivering reliable, affordable energy supplies. The IEA is damaging its long legacy as the world’s leading energy security watchdog by offering dangerously misleading outlooks.
Flawed Assumptions Lead to Flawed Conclusions
Listed below is a summary of the flaws in 23 (but far from all) of the assumptions used in the WEO scenarios that are relevant to guessing future oil demand. Meaningful scenarios for planning for future uncertainties should include a range of realistic inputs, not just those that are aspirational.
Assumptions about baseline factors that affect oil forecasts
- Assumption: STEPS is a useful baseline.
Flaw: The baseline scenario, rather than “business as usual,” assumes a future based on countries’ Stated Policies Scenario (STEPS), which not one country is implementing in full. - Corporate transition policies are real and durable.
Myriad corporations, having earlier proclaimed fealty to “energy-transition” goals, are either failing to meet such pledges or overtly rescinding them. - Higher economic growth is unlikely.
Ignoring the possibility of higher economic growth, based on historical trends and the goals of all nations, leads to scenarios that underestimate future oil demand. - Transition financing will continue to expand.
Alternative energy projects have become more expensive and difficult to finance, and wealthy nations are increasingly reluctant to gift huge amounts of money to the faster-growing but poorer nations, many of which have governance issues. - Efficiency gains and structural changes will lower global demand for energy.
Long-run trends show that energy-efficiency gains make energy-centric products and services more affordable and thus do not reduce, but instead generally stimulate, rising demand. - Solar and wind power are 100% efficient.
The WEO 2024 assertion that “most renewables are considered 100% efficient” contradicts fundamental physics and is, arguably, a silly PR-centric rhetorical flourish. - China’s actions will follow its pledges.
The scale of China’s role in present and future energy and oil markets requires scenarios that model what China is doing—and will likely do, in fact—rather than what China claims or promises.
Assumptions regarding oil’s future
- The oil growth in emerging markets will be low.
The fact of low demand in some poorer regions—e.g., Africa uses roughly one-tenth the per-capita level in OECD countries—points to the potential for very high, not low, growth in those markets. - The EV market share will accelerate.
Slowing market adoption and retrenchments in automakers’ EV plans or promises are evident, calling for scenarios that model realities that could persist. - Governments will stay the course on EV mandates.
Recent trends in many countries and U.S. states show policymakers weakening or reducing mandates and subsidies. - China’s EV “success story” leads quickly to lower oil demand.
Data point to the fact that in the real world, EV sales and gasoline consumption are both rising.
Assumptions about other transportation markets
- There will be significant electrification of heavy-duty trucks.
There is no evidence of market adoption for any fuel option that leads to far higher capital costs and enormous degradation in performance. - There will be significant electrification and fuel alternatives in aviation.
There are no trends showing non-oil options for even a tiny share of the aviation market, in an industry that forecasts booming demand. - There will be significant electrification and fuel alternatives for ships.
The only modestly significant change in oil used for global shipping comes from the use of liquefied natural gas, another (and generally more expensive) hydrocarbon. - There will be a rapid decline in oil used for Middle East power generation.
Despite pledges and pronouncements, the year 2024 saw continued, and even higher, use of oil for electricity generation. - The growth in petrochemicals and plastics will be slow.
Slower growth is anchored in recycling enthusiasms that markets are not adopting and expectations of new recycling technologies that remain expensive or unproved. - All scenarios lead to peak oil demand by ~2030.
A WEO core conclusion that “combing all the high cases” leads to “global peaks for oil” by ~2030 is, prima facie, not based on all “high cases” but on unrealistic scenarios.
Assumptions regarding associated industries
- The supply of critical minerals will meet transition goals.
Myriad studies have now documented the fact of a looming shortfall in current and expected production and of the challenges in changing that status quo. - Prices of critical minerals will be low.
It is fanciful in the annals of economic history to imagine that record-high demands won’t lead to far higher prices for the critical minerals needed to build EVs (as well as for wind and solar hardware). - China won’t exercise minerals dominance as an economic or a geopolitical tool.
China has already signaled over the past year that it is willing and able to implement export controls, or pricing power on critical minerals, where it holds significant global share. - Oil and gas annual investments are adequate to avoid economic disruptions.
Current levels of investment are not adequate to meet demands under business-as-usual scenarios, especially when combined with likely decline rates of extant oil fields. - The future decline rate from existing oil fields will continue historical trends.
The much faster decline rate in output from now-significant U.S. shale fields has altered the global average decline rate, pointing to the need for increasing investments to avoid a shortfall. - OPEC will be a reliable cushion to manage oil-supply disruptions.
History suggests that scenarios should include alternative possibilities to relying on OPEC to provide a cushion for meeting unexpected shortfalls in production or increases in demand.
Introduction: The IEA and the Information Imperative
Fifty years ago, Germany’s Ulf Lantzke, an official at the OECD, was appointed as the first executive director of the new International Energy Agency (IEA). The organization’s creation followed the 1974 “energy shock” and consequent global recession. The recession was triggered by a roughly 400% jump in oil prices, the fallout from the oil embargo imposed in late 1973 by some members of the Organization of Arab Petroleum Exporting Countries.1 The motivation for establishing the IEA was thus not only to forge an international mechanism for coordination in the event of global energy disruptions but also to create a trusted source of global energy information.
While much has changed in the world since 1974 in technological and political domains, what has not changed is the long-run trend of economic growth that uses more energy overall, including more fossil fuels. Not only do hydrocarbons continue to supply more than 80% of all global energy, but oil, the progenitor of the first modern energy crisis, remains the touchstone fuel in geopolitics and the single largest source of civilization’s energy supply. Energy markets and geopolitics are no less critical today than when the IEA was established, as is the need for reliable information.
However, following the 2015 Paris Agreement, the IEA recast its mission to adopt advocacy of an “energy transition” alongside the original mission to support “energy security.”2 In 2022, the IEA’s governing board voted to expand the agency’s mission as one “to guide countries as they build net-zero emission energy systems to comply with internationally agreed climate goals” (emphasis added).3 As one report from the European Parliament put it, the “IEA has become an advocate of ambitious reductions in greenhouse gas (GHG) emissions to combat climate change.”4
Without regard to the reasons for, or merits of, the shift in the IEA’s mission, the extent to which countries engage policies to displace hydrocarbons can itself have the potential to increase, rather than ameliorate, the risks of disruptions. Moreover, the extent to which such transition efforts become aspirational or motivational, rather than anchored in agnostic analyses, also creates challenges, in particular for information transparency and clarity for policy planning.
The publication each year of the IEA’s World Energy Outlook (WEO) is a major event for energy policymakers and analysts everywhere. It is enormously influential because the IEA has 31 governments behind it whose energy priorities its work reflects and because there are few other studies with the breadth and depth seen in the IEA’s work, which is freely available to everyone.
Where We Agree with the IEA
The data, including data in the WEO, show that, thus far, there is no evidence of a rapid or even significant energy transition. In 1973 oil, coal, and natural gas contributed 85% of primary energy consumption, and in 2023 the share was 82%.5 Because hydrocarbons are used, whether directly or indirectly, in all products and services, it is vital to ensure that there is an adequate, reliable, and affordable supply for all countries. For developing nations, this is particularly important since, for them, the critical transition is not from hydrocarbons to renewables but away from having too little or unreliable energy in general.
The 2024 WEO highlights the key challenge of meeting the surprising—at least in contrast to the previous year’s WEO—increase in the expected need for electricity supplies for both emerging and mature economies: “[O]ne of the striking findings of this Outlook is how fast demand for electricity is set to rise, with the equivalent of the electricity use of the world’s ten largest cities being added to global demand each year” (p. 2).
When it comes to providing the energy and materials needed for the electric sector, and all others, as Dr. Fatih Birol, the IEA’s Executive Director, notes in the WEO foreword: “The world is facing perilous times. Escalating conflict in the Middle East and Russia’s continued war in Ukraine have global attention sharply focused on some of the world’s most important energy-producing regions.” He notes that “energy security is again a major theme of this year’s World Energy Outlook” (p. 3). In that regard, few would disagree with Dr. Birol’s observation: “Robust, independent analysis and data-driven insights are vital to navigate today’s energy uncertainties” (p. 15).
Thus, we agree with the agency’s self-assessment: “The IEA’s flagship World Energy Outlook, published every year, is the most authoritative global source of energy analysis and projections. It identifies and explores the biggest trends in energy demand and supply, as well as what they mean for energy security, emissions and economic development” (p. 398).
Planning for the future is inherently a game of assumptions that can be plugged into models to consider potential outcomes around which governments and industries can make investment decisions. For planners everywhere, it is, of course, critical to gauge the extent to which models of future possibilities may be truly realistic, or merely aspirational, or even silly. Determining that depends almost entirely on assessing the underlying assumptions, the inputs to the models.
The assumptions integral to the IEA’s scenarios are based on explicit and implicit forecasts about both policies and, critically, about technologies.
The IEA clearly states that the WEO “examines three main long-term scenarios—none of which are forecasts—to provide a framework for understanding possible energy futures” (p. 67; emphasis added). However, the media and the analyst community treat the WEO as providing forecasts. There are myriad examples of invoking the “forecasts” from the IEA in news headlines and reports by financial analysts.6 The advocates of an “energy transition” also, unsurprisingly, invoke the WEO as providing forecasts: “The IEA’s forecast of an upcoming peak in demand for oil, gas, and coal remains unchanged.”7
This widespread conviction that the WEO makes forecasts, again, is not explicitly endorsed by the IEA, since the WEO repeats its caution in more than one place: “Our scenario analysis is designed to inform decision makers as they consider options, not to predict how they will act, and none of the scenarios should be viewed as a forecast” (pp. 20, 69; emphasis added).
This has important consequences because the IEA’s scenarios are often viewed as the gold standard and are used to guide the policies of myriad governments and companies everywhere. Given the centrality of energy to all countries, the WEO can influence decisions about trillions of dollars of projects, subsidies, grants, and
inducements, nearly all with the stated goal of achieving an energy transition away from hydrocarbons. As it observes, “all parties need to recognize that locking in fossil fuel use has consequences” (p. 20). Inversely, it is also true that locking out access to fossil fuels will have consequences.
When it comes to policy or investment planning, there is a distinction with a critical difference when it comes to what constitutes a “forecast” (what is likely to happen) versus a “scenario” (a possibility based on assumptions). The challenge is not in determining whether the scenarios are completely factual per se, but instead whether they are factually complete.
One cannot have an unmanageable range of assumptions, given that scenarios and models are frequently treated as “forecasts,” or, at least, reasonable predictors; the use of unreasonable—even if theoretically possible— assumptions can lead to outcomes that are, by definition, improbable, if not nearly impossible. Thus, a core security and economic challenge for policymakers is to have scenarios that inform about real-world possibilities.
Where We Disagree with the IEA
The IEA’s scenarios are based on assumptions about:
- Politics and policies: Whether governments and industries will or can do those things promised and whether those pledges already made, e.g., banning the sale of conventional cars, will be maintained
- Technology and engineering: The likelihood and timing of the maturation (cost, availability, reliability) of new energy technologies, e.g., the future cost of batteries for electric vehicles
The IEA asserts8 that the WEO “covers the whole energy system” to highlight “consequences and contingencies that lie ahead.” To realize that claim would require evaluating scenarios based on how, as the IEA states, “the energy system might be affected by changing key variables.” However, a careful reading of the voluminous WEO makes clear that the IEA does not come close to exploring the consequences arising from changes to key variables. Before turning to some of the claims and assumptions specific to oil (e.g., EV market penetration), we first highlight some key assumptions that are either flawed or disputable (thus calling for wider/different scenarios) that anchor those domains directly affecting oil-market forecasts.
1. Assumptions About Baseline Factors That Affect Oil Forecasts
In order to fully reflect, as the WEO puts it, “today’s uncertainties” (p. 15), scenarios should begin with the possibility that some, or many, governments could modify or even abandon the “Stated Policies Scenario” (STEPS) that has been framed for compliance with the Paris Agreement. Of the three scenarios modeled by the IEA, STEPS is used as the baseline WEO scenario, and the other two scenarios are modeled on even more aggressive pledges and aspirations for replacing hydrocarbons: the Announced Pledges Scenario (APS); and the Net Zero Emissions (NZE) scenario.
Flawed Assumption: STEPS is a useful baseline
In earlier years, the WEO included a business as usual (BAU) scenario providing insights into future energy demands based on what countries and companies are actually doing rather than what they say they might do, or “pledge” to do. The merit of a BAU scenario should be obvious not only because it is a baseline anchored in the world as it is, but also because it can illuminate requirements and consequences for future energy demands if the world continues to operate as is, rather than “as wished for.”
Using STEPS as a de facto baseline is not just problematic but a borderline delusion—“belief in something that is not true.” No nation is doing what it has pledged to do. Only 10 small nations (collectively, about 1% share of global energy) are “almost sufficient” in meeting their Paris Agreement pledges. None of the other 30 nations is close9 (see Figure 1).
Flawed Assumption: Corporate transition policies are real and durable
It is clear from both news about and surveys of corporations that many businesses are slowly retreating from (or some entirely abandoning) many of the existing as well as pledged energy plans that are inherent in STEPS.
In recent months, we have seen several examples of major energy companies diluting their commitments to energy-transition targets. Until mid-2024, for example, BP was committed to reducing oil and gas output by 25% by 2030. Under its new leadership, the company has instead revised upward its plans to produce oil in the Gulf of Mexico while at the same time announcing the sale of its U.S. onshore wind energy business. Shell, too, has watered down transition-centric commitments. Previously, the company committed to reducing the net carbon intensity of its energy products by 20% from 2016 levels by 2030, 45% by 2035, and to “net zero” by 2050. Shell is now aiming for a 15%–20% reduction by 2030 and has dropped the 2035 target. Neither Shell nor BP is mentioned in the WEO.
In its long-term outlook to 2050, published in August 2024, ExxonMobil forecasts that oil demand, rather than shrinking, would remain close to 100 million barrels per day (mmbd) and that high levels of investment in exploration and development would be required to meet such demand.10
We cannot know what further changes other corporations may yet make. But these examples—and there are many others—show that energy-transition targets made several years ago are now being reassessed, reduced, or rejected in the face of the reality of a world that is using a lot more conventional energy to meet the needs of expanding economies and populations.
While the IEA does not explicitly discount the potential for an extended era of higher economic growth in the next several decades, that is the implicit effect of WEO’s use of an average GDP growth rate that is at the low end of historical averages. It is problematic to base plans on the fact that all three WEO scenarios use the same assumption of a 2.7% annual growth for the global economy. The WEO offers the reasons: “We maintain a constant economic growth rate across scenarios to facilitate a comparison of the impacts of different energy and climate choices with a consistent backdrop” (p. 67). While there is some logic to that, it is prima facie an incomplete assumption for useful scenarios.
Figure 1: Ranking the Status of Paris-Centric Energy-Transition Plans

Meanwhile, the WEO, along with others, sees the massive investment under way in AI and digital infrastructures such as data centers as a stimulant for growth. The WEO does focus on electricity demand from digital infrastructures, but that misses the broader point: those market-driven investments come from the economic value of the associated products and services, which suggests the potential for more growth than modeled.
No economist or policymaker should believe that he can predict the actual future economic growth rate. But for planning purposes, it is crucial to understand the consequences of a higher growth rate, not least because the pursuit of prosperity remains a central goal of (most) governments and because annual GDP global growth rates have frequently been a half-percentage point higher than the WEO models (see Figure 2). The WEO’s 2.7% annual growth rate is lower than the 3.2% average rate from 2010 to 2023. A scenario assuming, say, the same 3.2% annual growth rate—and a BAU relationship between GDP and oil—would lead to global oil demand in 2035 some 10 mmbd of oil greater than today. That difference is equal to adding another entire Europe Union to global oil demand.
Figure 2: Global GDP Growth Rate
Flawed Assumption: Transition financing will continue to expand
Financing society-scale alternative energy technologies is proving to be a major obstacle to the achievement of energy-transition goals. While it is in developing countries where we find the need for most alternative energy finance, it is the developed world where most of the money goes. The WEO notes that “the share of clean energy investment in emerging market and developing economies outside of China remains stuck at 15% of the total, even though these economies account for two-thirds of the global population and one-third of global GDP” (p. 21). Whether, and how, this share can increase is a key issue for transition aspirations; real-world models would include scenarios where that issue remains unresolved.
Before looking at the immediate trends in energy financing, it is worth pointing out that the assumptions underpinning the financing of the Net Zero Emissions (NZE) scenario are fantastical. The WEO states that in the
NZE scenario, “annual spending on clean energy doubles in advanced economies and in China by 2035 compared with 2023 levels, while it grows more than six-fold in other developing economies” (p. 61; see Figure 3). There is no sign that this level of increase is happening or credible.
More modest climate finance targets—such as the commitment made at COP15 in Copenhagen in 2009 by rich countries to provide $100 billion each year in climate finance to developing countries—have not been met. The OECD tracks four primary sources of climate finance under the umbrella of that $100 billion initiative, and for the period 2013–21, the cumulative shortfall was $265 billion. Only in 2022 (the latest data available) was the target exceeded (see Figure 4). However, according to Oxfam, the British aid charity, even this apparent modest success is not what it seems.11 Oxfam reports that of the $116 billion pledged in 2022 (the last year for which OECD data are available), $92 billion was public finance, of which 70% was in the form of loans at market interest rates, not grants.
Figure 3: The WEO’s Fantastical Assumptions About Investment

Figure 4: Pledged vs. Actual Energy-Transition Financial Aid Sent to Emerging Markets
The $100 billion tracked by the OECD is only a small part of the $2 trillion estimated by the IEA to have been committed globally in 2024 for “clean energy” investment. The WEO reports that $4.5 trillion a year is needed by 2030 and beyond to implement the NZE scenario (p. 155). In view of all the domestic pressures on governments in wealthy countries, the continuing impact everywhere of relatively high interest rates, and the continuing—if somewhat moderated—inflation in the costs of workforce and materials, it seems fantastical to believe that such an increase is feasible.
The investment challenge is summed up well in the WEO, even if the scenarios ignore the variables. The IEA sees three categories, or groups—which, again, should be modeled, but are not fully modeled. In the first group, investing in mature alternative energy technologies in well-regulated markets such as Brazil and India can be handled by the private sector. In the second group, the WEO calls for “facilitated interventions” (p. 65) to increase the deployment of alternative energy in less developed countries. The IEA notes that this “cover[s] projects where the national creditworthiness is low and a constraint on investors, or where significant social returns, such as those arising from improved energy access, need some form of public support to ensure affordability and bankability” (p. 65). How much appetite there is in the private sector and, indeed, international institutions for “facilitated interventions” remains to be seen. Certainly, the debates and resistance to such expansion are evident and, again, suggest that scenarios need to incorporate fewer, not more, financial “interventions.” The third group, albeit representing only about 6% of projects in the NZE scenario, essentially covers very high-risk countries (a euphemism for corrupt and unstable) that might involve “nascent” (p. 65) technologies (a euphemism for either unproven or nonexistent on a commercial scale).
Flawed Assumption: Efficiency gains and structural changes will lower global demand for energy
A significant feature in the WEO scenarios entails claims about the means not only for reducing energy growth but for the possibility of achieving an absolute reduction in overall energy use, even as populations and economies expand. Setting aside the questionable durability of imposed mandates (such as banning the sales of conventional vehicles or natural gas residential heating), or proposed behavioral changes (such as fewer personal automobiles, fewer vacation flights, etc.), the WEO rests much on the effect of changes to the “structure of the global economy” and the effect of greater technical efficiency. The former is the continued migration of nations to service-centric economies and the latter to efficiency gains in end-use equipment (pp. 25, 26).
That maturing economies migrate toward greater dominance of services in their GDP, rather than industries, is a well-established long-run trend. But that trend has not resulted in lowering overall global energy demand; rather, it has shifted much demand from mature to emerging economies. It has also created the illusion of lower energy use in mature economies, thus creating misleading impressions of improvements in national energy efficiencies. Domestic energy efficiencies should be more properly calculated, especially for the U.S. and Europe—the exemplars of the service-efficiency trend—by including the energy embodied in imports of products or materials (e.g., steelmaking and aluminum) from countries such as China or India. The aviation industry, for example, is a service sector with operational energy uses that, self-evidently, include the use of energy-intensive hardware and materials, but much of the latter is produced offshore and is invisible in domestic data.
Regarding long-run efficiency trends of devices and machines, the WEO reflects well-established views that there are “improvements in the technical efficiency of energy use, via more efficient processes or equipment” (p. 26). In a static economy, that would arithmetically result in lowered energy use. However, as is widely known, the overall long-run reality is that foundational efficiency gains drive net growth in overall demand— the so-called Jevon’s Paradox. There is no evidence that this multi-century trend has changed in recent decades (see Figure 5).
Figure 3: Global Trends: Energy Efficiency vs. Total Energy Consumption
Flawed Assumption: Solar and wind power are 100% efficient
In the WEO discussion about energy efficiency, we find a particularly odd, and fundamentally incorrect, claim that has the earmarks of an overenthusiastic talking point, rather than an idea rooted in reality: “Unlike fossil fuels, most renewables are considered 100% efficient, i.e., conversion losses are not measured because the resources are directly harnessed from naturally occurring sources of energy, such as sunlight, wind and water, without the need for extraction or combustion processes” (p. 27; emphasis added).
The observation that the sun and wind “resources are directly harnessed” is misleading, an artifact of boundary choices. The harnessing requires building machines that entail energy-intensive materials that significantly affect resource-to-user efficiencies. Fabricating solar photovoltaic (PV) silicon, for example, is at least 10-fold more energy-intensive per pound than fabricating steel.
Regardless of the rhetorical flourish about “directly” harnessing, the 100% claim itself is simply a violation of fundamental physics, both incorrect and impossible. There are conversion losses; one has to define boundaries. Claiming 100% efficiency for a PV cell’s output is logically the same as claiming 100% efficiency for a combustion engine’s output.
A conventional (widely used) PV cell converts ~15% to 20% of the available energy in incident photons into electricity. The physical scale, economic, and materials costs of solar electricity are, self-evidently, dictated by that inefficiency and the very low energy density of the primary source (incident solar energy).
A conventional (widely used) gas turbine converts ~40% to 60% of the available energy in natural gas into electricity. A conventional combustion engine converts ~20% to 30% of the available energy in fuel into mechanical energy.12 The scale, costs, and materials used are similarly dictated by that inefficiency but offset by the far higher density of hydrocarbons.
Higher efficiencies have been demonstrated for both PV cells and engines using existing materials and technologies, as much as about 50% for PV cells and nearly 80% for combustion turbines. There is, from the physics (and economics) of wind and solar, nothing particularly unique in that regard, or inherently more efficient.
Flawed Assumption: China’s actions will follow its pledges
Before turning to the assumptions that are specifically focused on scenarios for future oil demand, we note one additional example of WEO assumptions that are debatable, if not profoundly unrealistic: those associated with China’s energy trajectory. The WEO sees China’s coal use starting to shrink in a few years (see Figure 6). This seems unlikely, given that China’s electricity generation from coal in 2023 was 37% higher than a decade earlier;13 and in the same period, China has added to its grid 390 GW of new coal-fired capacity, and there are plans for another 141 new power stations (not taking into account retirements).14 Considering that such power plants have an operating life of over 40 years, a reasonable scenario would also model increasing, not declining, coal use, regardless of China’s “stated policies.”
Figure 6: WEO China Energy Scenario

Figure 7: Transportation Costs as a Share of Final Product Prices
2. Assumptions Regarding Oil’s Future
Petroleum supplies 40% of global energy, wind and solar combined about 4%, and all other renewables— mainly hydro dams and biomass—bring the renewable total to under 10%.
Over 95% of the movement of all people, goods, and services is powered by machines that burn oil.15 Since 1974, the number of cars in the world has increased by 500%, total maritime tons shipped is up 350%, and air-travel passenger miles have risen nearly 2,000%.16 Economies collapse if the costs of transportation soar or, worse, cease (see Figure 7).
In the WEO, as well as in the IEA’s monthly Oil Market Report and its latest medium-term outlook Oil 2024— Analysis and Forecast to 2030, the agency assumes that global oil demand will peak before 2030, based on the WEO’s STEPS—that current policies and programs will be implemented as planned. However, as outlined above, this is less, rather than more, likely to be the case. This is partly because of the inevitable changes in governments, not least in the U.S., which has the world’s biggest oil market. Furthermore, it is highly unlikely, given the current political climate in many key countries, that future changes will lead to tougher policies to implement the Paris Agreement. Rather, the commitment is likely to weaken.
In the 2024 WEO (chap. 4), the IEA considers the possibility that oil demand could be higher or lower than shown in the STEPS. Although this might appear to be a nod to criticism leveled at the 2023 WEO, which also did not contain a BAU scenario, the variations in oil demand considered in the 2024 WEO are far from a realistic assessment of known ranges of possibilities.
In a recent edition of its Oil Market Report17 and its five-year outlook,18 the IEA shows global oil demand rising from 102.9 mmbd in 2024 to 105.4 mmbd in 2030, with the expectation that 2030 is a definitive peak. This is wishful thinking, given the realities of growing needs in developing countries. For global oil demand to peak by 2030, it must be assumed that developing countries won’t grow at the pace seen in recent decades—never mind, the hoped-for faster growth.
Petroleum liquids consumption by OECD countries did peak back in 2005 and today it is 11% lower due to efficiency gains, saturation in some passenger vehicle markets, and a significant drop in oil used for electric power generation (mainly in Europe).19
In 2005, when OECD oil demand peaked, the rest of the world’s far greater population used just 67% as much oil as the rich countries. That ratio has flipped: it is now the OECD that uses only 81% as much oil as do all the developing countries.20
Flawed Assumption: The oil growth in emerging markets will be low
While the growth of oil demand in developing countries has been significant, there remains an enormous disparity when it is compared with the per-capita oil use of the wealthier OECD nations. Even in China, which has seen three decades of strong economic growth, oil use per capita remains only 36% of the OECD average. More significantly, India uses only 12% of the OECD’s per-capita average, and Africa is at only 9% of the OECD average.
Populations in developing countries are growing rapidly: Nigeria’s population, for example, is expected to grow from 230 million in 2024 to 380 million by 2050. For India, the corresponding numbers are 1.44 billion to 1.67 billion; the numbers in the African continent are 1.49 billion to 2.49 billion. The net increase in overall global population by 2050 versus 2024 is estimated to be 1.6 billion people.21 Many of them could be, by 2050, even wealthier than the doubling of global GDP that the WEO assumes (p. 301).
It is inconceivable that these rising populations with growing economies will not experience enormous increases in oil use. This will come from increasing numbers of internal combustion engine (ICE) vehicles of all kinds, and, as disposable incomes rise, far more citizens will not only travel but also buy more goods. The latter, in turn, means more plastics, which requires more petrochemicals, i.e., more oil and gas.
With little credibility, the WEO asserts that its sensitivity analysis shows that “even combining all the high cases, global peaks for oil, natural gas and coal demand would still occur within a few years of those for STEPS, albeit at higher absolute levels” (p. 165; emphasis added).
The realistic potential for very strong upward oil-demand pressure from developing countries is entirely absent from WEO scenarios.
Consider a useful exercise to illustrate the theoretically possible growth in oil demand outside OECD countries. One could simply extrapolate China’s current per-capita oil use to the rest of the non-OECD world. China is a useful benchmark because its oil use has increased year-on-year since 1993 (demand did not fall, even during the pandemic lockdowns of 2020) and is now seven times higher than 30 years ago.
Non-OECD (excluding China) oil demand at Chinese per-capita levels would be 23 mmbd higher than today, representing 10-fold more growth than in the WEO STEPS. That increase would more than offset declining gasoline use in wealthy nations, leading to global demand reaching 126 mmbd—some 20% higher than the peak imagined by the WEO (see Figure 8).
If emerging markets were ever to match the OECD average per-capita usage, global oil demand would exceed a staggering 230 mmbd, versus 103 mmbd in 2024. For many reasons, we are not suggesting that developing countries will soon, or even ever, reach the OECD per-capita oil level. But 230 mmbd gives one a sense of the direction of potential ultimate demand.
Even though the WEO failed to do so, it would be reasonable to assume a baseline scenario where emerging-market oil demand grows at the same annual rate of 2.3% seen since 1990.22 This would yield in 2030 a demand that is 6.7 mmbd higher than in 2023; and in 2035, it will be 12.1 mmbd higher, both of which are about 3 mmbd and 9 mmbd higher than the WEO STEPS.
The gap between a reasonable BAU scenario and the WEO widens if one, also reasonably, assumes that there is a good chance that wealthy economies will see less of a decline in oil use than assumed in all the WEO scenarios. Assumptions about the market penetration of electric vehicles (EVs) are, of course, the central feature in the WEO oil calculations.
Figure 8: Oil-Demand Potential
Flawed Assumption: The EV market share will accelerate
The far greater use of EVs constitutes a centerpiece of the WEO. For that reason alone, a full range of variables should be, but are not, incorporated into its scenarios of future demand. The WEO assumes that the “market share of new electric passenger cars sold in the STEPS reaches about 45% by 2030” (p. 174) and “to over 55% by 2035” (p. 160).
The recent, rapid growth rate of EV sales in wealthy nations is slowing, not accelerating. RegarOPECdless of whether the slowdown is temporary, or the new normal, that reality should be in planning scenarios. IEA data show that 11% of vehicles sold in the U.S. in 2023 were electric. For the world, EV sales that year were 18%—but that figure is highly distorted by China’s massive domestic subsidies, resulting in that nation accounting for 60% of global EVs sold. Meanwhile, the 2023 share of EVs sold in India was 2%, Brazil 3%, Indonesia 2%, Malaysia 2%, Thailand 10%, and Vietnam 15%.23 In developing countries with rapidly growing populations, the rate of ownership of any type of vehicle is still very low: India has only 59 cars per thousand people of driving age, compared with 226 in China. In Nigeria, the figure is 61. For context, in the U.S. there are 908 cars per thousand people of driving age.24 Whether rising vehicle ownership is dominated, or not, by EVs will depend on many factors, but in the main, by price.
In its annual EV report, the IEA estimated that in 2023, EVs displaced about 0.8 mmbd of global oil demand (gasoline and diesel).25 In the conclusion of its 2024 oil report (one of the inputs to the WEO), the IEA asserts that efficiency improvements and electrification mean that global gasoline use peaked in 2024, at 27.2 mmbd; and by 2030, it will have fallen to 25.4 mmbd. But this is based on “policy settings,” not by real-world trends.26
The behavior of automakers offers an obvious example of a divergence between policy settings and reality, trends that have been clear for many months prior to the publication of the 2024 WEO. The WEO asserts that “the number of electric car sales in the STEPS is aligned with the plans of the automotive industry. Although some automakers have recently scaled back short-term EV production plans, their longer-term EV plans still point to the production of well over 40 million electric cars per year by 2030” (p. 36). The WEO does go on to note that there “have also been some rollbacks and postponements of previous [EV] policies, although the impact of these remains relatively small” (p. 81). A reasonable sensitivity analysis would at least consider the trends continuing, and even expanding.
During 2024, there were myriad announcements from car manufacturers that the production of EVs would be lower than forecast in response to weaker consumer demand. A recent example was the Ford Motor Company’s third-quarter 2024 results.27 The company lost $1.2 billion in its EV business. Based on the sales volume of 20,962 EVs, Ford lost nearly $60,000 on each such vehicle sold. But Ford’s forecast is not the only one. Volkswagen, General Motors, and Mercedes are also paring back their market forecasts.28 Fundamental issues impair consumer adoption, not least EVs’ affordability. There was also the performance of EVs in cold weather, inadequate charging infrastructure in general, and, especially, the cost and availability of high-speed charging to come closer to the refueling time for regular gasoline vehicles. Meanwhile, the EV market consists largely of wealthy buyers.
Flawed Assumption: Governments will stay the course on EV mandates
In the WEO, the IEA points out that of the 17 million units estimated to have been sold in 2024, 10 million will be in China (p. 34). In a command economy, there is little transparency concerning costs and revenues, and there is no doubt that massive government subsidies have played a major part in China’s EV expansion. In Western countries, subsidies are being scaled back. At the end of 2022, the German government abruptly cut back its subsidies. Sweden did the same thing early in 2023, as did New Zealand at the end of the year. While government support for EVs continues in those countries and others, budgetary pressures are now a factor in scaling back support.
The new Trump administration is unlikely to tighten regulations governing the fuel-efficiency standards for ICE vehicles. Indeed, some rollback is expected. Also, the subsidies for EVs and batteries built in to the Biden administration’s Inflation Reduction Act (IRA) could be scaled back. In the EU, the political drive behind environmental measures is, at a minimum, fracturing following elections in several member countries.
When the 2024 WEO was developed, the IEA could not have anticipated the U.S. election outcome. But a reasonable sensitivity analysis would incorporate the slowdown and reversals of EV subsidies in other nations, and consider the fact that any anticipated increase in U.S. subsidies was already at risk (p. 37). Ahead of the 2024 U.S. election, the costs of the IRA subsidies were already subject to increasing scrutiny, not least by a report from the National Bureau of Economic Research (NBER) noting that the IRA spends $32,000 for each additional EV sold and that 75% of the EV subsidies claimed thus far under that law have gone to consumers who would have bought an EV anyway.29
Nonetheless, the WEO sticks to its fundamentally optimistic—and, from a scenario modeling perspective, narrow—assumptions about EVs, such as: “Although some incentive schemes have been revised, governments remain active in supporting EV uptake in a variety of ways” (p. 37). Another such assumption: “Around 30 countries have set zero emissions vehicle goals or timelines to phase out ICE vehicles. In the STEPS, electric car sales reach more than 40 million globally by 2030, which means that nearly one-in-two cars sold that year will be either a battery electric or a plug-in hybrid vehicle” (p. 110).
Flawed Assumption: China’s EV “success story” leads quickly to lower oil demand
China, which is regularly cited by the IEA and others as a major success story for EVs and significant oil displacement, may not be as it seems. A recent paper by Kpler, a global data and analysis company, suggests that although sales of EVs in China reached a 51% market share in September 2024, at the end of the year the total on-road vehicle fleet was still over 80% gasoline-fueled, with EVs at 13%.30 Kpler points out that gasoline cars will still constitute 70% of China’s fleet in 2030 and that the share will not fall below 50% until 2040. The impact on gasoline demand will not, according to the company, be as dramatic as many believe. Today, with large numbers of gasoline cars still being purchased, only 1% of new EVs are replacing gasoline cars. At expected rates of EV growth, it won’t be until the early 2030s that EVs lead to net displacement of existing gasoline cars. Before then, gasoline demand in China will remain relatively stable. Yet the IEA believes that gasoline demand in China “may even tip into decline from 2025 amid rampant, mass-market electrification.”31
Another issue highlighted in Kpler’s paper is the discrepancy between theoretical claims of gasoline consumption from carmakers and the actual performance in the real world. In China, real gasoline consumption is about 15% higher than claimed by the manufacturers, and today the fleet is not reaching the aspirational fuel-consumption goals. The Kpler analysis finds 248,000 barrels a day of gasoline being displaced in China by EVs, versus the IEA’s estimate of about 600,000 b/d.32
3. Assumptions About Other Transportation Markets
Although EVs constitute the epicenter of variables relevant to future oil displacement, the WEO devotes considerable effort, and apparent enthusiasm, to the potential for electrifying virtually all other forms of transportation and adjacent uses for petroleum. One may be tempted to speculate about PR motives, i.e., providing the impression of “accelerating” electrification of everything (see Figure 9). The fact is that these other sectors are either realistically impossible to significantly electrify (e.g., heavy-duty trucks, aircraft), or, where it is easy (e.g., bicycles), the oil displacement is irrelevant. The WEO notes that electrifying global two- and three-wheelers would displace 750,000 barrels per day, or under 1% of demand.
Figure 9: Forecast Global Market Shares
Flawed Assumption: There will be significant electrification of heavy-duty trucks
Trucking, which accounts for ~17% of global oil use, compared with ~25% for automobiles, will remain a hard sector to electrify, especially in long-distance applications. The reasons are similar to those affecting the growth of EVs in the passenger market: the range and time needed for recharging. Electrification is likely to proceed in short-haul delivery fleets, buses, etc., a trend visible in China’s command economy, where heavy-duty trucks saw a 10% share of sales in 2023 (p. 109); but globally in 2030, only 3% of larger trucks will be electric (p. 110).
Cost remains a major barrier for electrifying long-distance trucks, with new vehicle prices two to three times higher than conventional diesel-fueled vehicles.33 Even if costs fall, the collateral challenges for improvements to charging infrastructure remain daunting. Electrification is not yet a significant factor for trucking and buses. In 2023, only 3% of all bus sales were electrified. The IEA does not provide data for 2023; but we know that in 2022, only 1.2% of worldwide truck sales were electric.34
Flawed Assumption: There will be significant electrification and fuel alternatives in aviation
Global aviation accounts for about 10% of all oil use. The WEO acknowledges the exceptional difficulty of electrifying aviation or decarbonizing the fuel, but it devotes significant effort to imagining opportunities and, more critically, ignores factors that could drive far higher oil demand. It points to various initiatives to increase blending into the aviation-fuel pool of “sustainable fuels”; but in 2030 and 2050, they will contribute only 2% and 10%, respectively (p. 111). All this is in the context of WEO’s anemic projections for potential increases in aviation-fuel demand.
The IEA base case (STEPS) sees jet-fuel consumption in 2030 just 13% higher than in 2024, and the pre-Covid peak demand not reached again until 2027. Meanwhile, independent data from the Airports Council International (ACI) show that 2024 passenger volumes are already at 106% of the 2019 level.35 In the longer term, ACI forecasts that passenger volumes by 2042 will be double the 2024 level. While aircraft-fuel efficiency will inevitably improve, the rise in passenger numbers suggests that fuel consumption could grow far more than in the STEPS (p.316). And the APS implausibly sees jet kerosene consumption peaking by 2030 and down 4% by 2050.
All this is in the context of an industry that is expected to boom in the decades to come. Asia is a major source of expansion, with a 57% growth in intra-regional travel demand projected by 2030 versus the pre-pandemic year of 2019.36 Moreover, air-cargo shipments are also expected to grow. While air freight is only 1% of global trade by volume, it represents 35% by value.37
The WEO also failed to acknowledge the travails of aircraft manufacturers, specifically those in the global duopoly of Boeing and Airbus Industries, in delivering newer and more efficient aircraft. Delays in updating the fleet mean that older, more fuel-hungry, aircraft will remain in service longer. At the same time, many airlines are keeping older aircraft in service for longer, in order to meet demand and save capital. Older aircraft, however, typically burn 15% more fuel than newer models.38
These factors will collaterally drive the need for greater airport capacity, a facet of the market ignored or underestimated in WEO scenarios. Independent analysts see six of the 10 most significant global airport projects located in Asia and the Middle East and two in the U.S. (Los Angeles and New York). The word “airport” doesn’t appear anywhere in the WEO.39
Flawed Assumption: There will be significant electrification and fuel alternatives for ships
Some 80% of global trade is carried by ships. While the STEPS in WEO correctly sees international bunker-fuel demand growing out to 2050, the APS projects a 9% decline by 2035 (p. 304).
The targeted reduction in shipping fuel use was set by the International Maritime Organization seeking a 20% CO2 emissions reduction by 2030, 70% by 2040, and full-scale decarbonization around 2050 (benchmarked from 2008 levels). Real-world analysts see no prospect of meeting shipping goals in either STEPS or APS. As of June 2024, 93% of the gross tonnage of ships in operation used conventional fuels (various grades of fuel oil/ marine diesel).40 The other 7% consisted almost entirely of LNG-fueled ships with minuscule shares for LPG and nonconventional fuels (ammonia, hydrogen, methanol, and battery/hybrid vessels). For ships on order, oil-fueled accounts for 51%, with LNG’s share at 36%. And while the WEO frequently mentions hydrogen and ammonia (e.g., p. 111), those fuels account for 0.7% of orders.
We note that the WEO doesn’t mention the one viable opportunity for reducing maritime fuel use: the potential for ships to use electricity when docked at port. As much as 7% of ships’ energy consumption occurs there, and from 2030 and 2035, respectively, two sets of EU regulations state that certain categories of vessels must connect to shoreside electricity while docked. The EU regulations are complex and look unlikely to be fully implemented; nonetheless, they are in place.41
Meanwhile, the IEA nowhere mentions the potential for a massive rise in demand for shipping—and collaterally for fuel used. This is directly related to the huge increase in the need for minerals required for constructing the alternative energy hardware imagined in all WEO scenarios. The WEO does provide estimates for the staggering increases in mineral demands but ignores the shipping. The Maritime Executive magazine estimates that 2,300–3,500 new ships will be needed annually through 2040. Shipbuilders are currently adding 400–500 new bulk carriers a year.42
Flawed Assumption: There will be a rapid decline in oil used for Middle East power generation
The WEO points to the significant 1.7 mmbd of oil burned in the Middle East’s power-generation sector, representing 25% of that region’s electricity supply (p. 177). While the WEO acknowledges that there is much uncertainty about whether this oil will be replaced by natural gas and renewables, STEPS assumes a nearly 50% drop in oil use by 2030. However, thus far there is little evidence of concrete action being taken in those countries to turn “stated policies” into reality within the next few years. Indeed, data show that in July 2024, Saudi Arabia saw the second-highest monthly oil burn ever for power generation.43
While the IEA correctly points to such initiatives as the Liquid Fuel Displacement Programme in Saudi Arabia, part of that nation’s overall Vision 2030 economic development and diversification strategy, it is not clear that those plans will be implemented to meet the targets included in STEPS.44 In the IEA’s own words, “specific plans to achieve this objective have not yet been established” (p. 177).
The reduction of oil used in power generation may occur in due course, given many long-term plans, including for local natural gas gathering projects, as well as investments in wind, solar, and nuclear energy. The UAE has three nuclear reactors, and Saudi Arabia, Qatar, Kuwait, and Iraq have expressed interest in nuclear energy. But none of this will be relevant by 2030.
Flawed Assumption: The growth in petrochemicals and plastics will be slow
The WEO identifies petrochemicals, today about 20% of global oil use, as the one sector that will see growth through 2035 in both the STEPS and APS (p. 139). Global LPG/ethane and naphtha demand will rise by 14% by 2030. Europe is the exception, where a slight decline is forecast, due to weak economic growth and a shift of petrochemicals manufacturing to Asia.
The WEO joins many other analysts in seeing the growth of petrochemicals in China. Much of that will be driven by the significant and unavoidable use of lots of plastics in the manufacture of EVs, wind turbines, and solar panels, in addition to the universal use of polymers in clothing, packaging, building materials, household goods, medical products, consumer goods, etc. (p. 140).
While assumptions about recycling are key to forecasting in the plastics sector, the WEO states:[1][O]ver 90 countries have passed a full or partial ban on single-use plastics and more than 20 to establish recycling targets and collection policies. Nonetheless, plastic waste collection for recycling has increased only relatively modestly: 12% of global plastic waste was collected for recycling in 2010, which rose to just 19% in 2023, with marked differences between the collection rates in advanced economies (27%) and emerging market and developing economies (13%). Policy momentum would be boosted by the conclusion of the United Nations’ treaty to end plastic pollution, which has been under negotiation since 2022.45 (p. 120)
After the WEO was published, the fifth session of the Intergovernmental Negotiating Committee on the Global Plastics Treaty (INC-5) finished without a deal.46
The WEO notes that there are interesting but uncommercialized technologies to enhance recycling (p. 120), and it suggests unspecified increases in R&D and recycling facilities. But sensible scenarios would include the low probability of that happening soon, or of any global treaty being enacted, or of significantly greater recycling rates after years of exhortation by governments and widespread bans on such things as plastic shopping bags, bottles, and straws.
The 2.7 mmbd of oil demand that WEO’s APS states can be avoided by 2050 is, at best, a questionable assumption (p. 120).
Flawed Assumption: All scenarios lead to peak oil demand by ~2030
The WEO’s overarching conclusion, widely repeated in media around the world—and, as noted earlier, often cited as a “forecast”—was that, “even combining all the high cases, global peaks for oil . . . would still occur within a few years of those for STEPS, albeit at higher absolute levels” (p. 165; emphasis added).
Yet it is clear that if the WEO were to have properly included a BAU scenario—which reflected a more realistic range of outcomes associated with known variables for potential oil demands, as outlined above—then peak oil demand would not occur in the time frames explored (see Figure 10).
Scenarios based on real-world trends of rising global oil demands should suggest to policymakers that the world could experience, and should plan for, even greater challenges associated with both the affordability and security of oil supplies.
4. Assumptions Regarding Associated Industries
The WEO’s scenarios are also anchored in numerous other problematic assumptions. We consider, briefly, three other classes of such assumptions: those relating to the availability and prices of critical minerals (a key input for EV costs, and thus adoption); the security of the supplies of those minerals; and the adequacy and security of future petroleum supplies.
Flawed Assumption: The supply of critical minerals will meet transition goals
The IEA has recognized and studied the fact that increasing the use of EVs entails a fundamental shift from enormous petroleum liquid supply infrastructures to other enormous infrastructures involving solid materials and chemical refining to produce the batteries. Indeed, in 2021 the IEA issued a seminal report on the nature and quantities of “energy minerals” that will be needed to build the hardware contemplated in the energy-transition scenarios.47
The expansion of mining operations for critical minerals is a linchpin for the achievement of IEA’s long-term energy-transition goals. The agency acknowledges that mining operations are highly capital-intensive and require very long lead times but fails to model the consequences of a world undersupplied with “energy minerals.”
In what constitutes an epic understatement, the WEO observes that for “a number of critical minerals, supply growth from the pipeline of confirmed and announced projects is set to be slower than expected growth in demand” (p. 33). Setting aside optimism about the availability of capital and the absence of environmentalists’ opposition to new mega-mines, the WEO sees a significant near-term, one-decade gap between the supply and demand for minerals needed (see Figure 11).
From outside the IEA, there are now numerous excellent analyses of mineral constraints, many of which do a more creditable job of exploring various metals markets. In a May 2024 report from the International Energy Forum that focused on copper, there is a key conclusion that “just to meet business-as-usual trends, 115% more copper must be mined in the next 30 years than has been mined historically until now. To electrify the global vehicle fleet requires bringing into production 55% more new mines than would otherwise be needed.”48
The WEO is eager to point out that such facts “should not be interpreted to mean that energy-transition goals are unattainable due to material constraints” (p. 218; emphasis added). Perhaps—but one sensible interpretation is that the goals could indeed be material-constrained. Failure to incorporate the full range of minerals challenge is a key flaw in the WEO assumptions. Policy makers would reasonably want a scenario that modeled the consequences in terms of what would be feasible in scenarios of insufficient metals supply.
Figure 10A: WEO Scenarios
Figure 10B: Business as Usual and Possible Scenarios
Figure 11: Supply and Demand for “Energy Minerals”
The WEO offers as an overarching idea what can only be termed a naively optimistic faith in markets to solve the minerals problem: “Market signals should lead to the development of new projects, although new mining projects tend to have very long lead times” (p. 33; emphasis added).
The idea that “market signals” will result in an adequate supply of critical energy minerals is belied by IEA’s own analysis of the timelines (10–15 years) required for developing new mines. No economist doubts that the word “signal” means higher prices, and necessarily (given long lead times) for very long periods.
While the WEO observes that “low prices” could lead to mine closures, further constraining supplies, it offers, without specificity in terms of efficacy, a set of aspirational—and some, frankly, risible—policy ideas that, it proposes, could lead industries to increase production:
- “Incentivizing products which score highly on ESG criteria can also help diversify supply sources”
- “Subsidies or tax credits are another option for supporting the production of responsibly sourced
materials, for example by linking eligibility to the procurement of a certain percentage of material supply from responsibly and sustainably produced materials” - “Carbon accounting frameworks and carbon pricing scheme could also help drive pricing differentiation between various sources of materials.” (p. 218, emphases added)
Flawed Assumption: Prices of critical minerals will be low
In a startling acknowledgment, the IEA states: “We do not yet model full long-term supply-demand balances for critical minerals in the same way as for fuels” (p. 91; emphasis added). This is a major flaw in a central part of all the WEO scenarios and surprising in its absence, since the IEA identified this knowledge gap nearly four years ago in its own energy minerals study. The WEO notes: “Around 30% of the cost of a battery pack now depends on the cost of critical minerals, and battery costs are increasingly susceptible to mineral price volatility.” And that “there is no alternative at present for some of the critical minerals” (p. 96; see Figure 12).
Figure 12: Cathode Raw Material Costs as a Share of EV Battery Prices
Since a “market signal” of higher prices is essential for supplying adequate materials, it begs the question as to the impact of those prices on the final cost of batteries for EVs (as well as mineral-dependent wind and solar hardware) and derivatively the impediments to consumer adoption. The WEO doesn’t ignore the possibility that “reduced investment [in minerals] could lead to future supply shortages and price spikes. This could slow reductions in clean energy technology costs, or even increase them, as happened in 2022 with battery pack prices, potentially clean energy technology deployment” (p. 94; emphases added).
The WEO hedges its rhetoric but not its models, observing that[2]lower [mineral] prices have helped to bring about lower clean technology costs, including a 14% reduction in battery pack costs in 2023 but they are now dampening the investment appetite for new resource developments, with implications for future supply diversification (BNEF, 2023). In the case of nickel, for example, three-quarters of operating or potential projects that are at risk in today’s price environment are outside the top-three producing countries. If they close because of low prices, supply will become further concentrated among the largest suppliers. (p. 216; emphases added)
Again, the IEA does not model these implications. Instead, the WEO, incredibly, simply ignores the possibility of a scenario with higher-, not lower-cost, EVs.
Flawed Assumption: China won’t exercise minerals dominance as an economic or a geopolitical too
There is rising geopolitical concern over the fact that control of vast stocks of the critical minerals needed for the manufacture of batteries is highly concentrated in a few countries, some of which have geopolitical priorities that have the potential to clash with Western interests. This is true not just for raw materials and refined minerals but also for key components of wind, solar, and battery hardware (see Figure 13).
Figure 13: Global Market Shares: Key EV Battery Components
The WEO cautions: “Security of clean energy supply chains and critical minerals—The overall level of geographic concentration in manufacturing is therefore set to remain high, even if all announced projects come to fruition” (p. 214). Since, as the WEO also notes, energy mineral resource concentration is far greater than with hydrocarbons, it cautions: “Policy makers need to be alert to the new energy security risks that are emerging in clean energy and look for ways to mitigate them” (p. 33). However, again, there is no attempt to include in scenario models the implications arising from such “resource concentration.”
The IEA points out that China produces 80% of the world’s battery cells. It controls 65% of the global processing capacity for lithium and 75% of the global processing capacity for cobalt. China also produces 50% of the world’s lead (p. 76). A handful of other countries are dominant players in critical minerals. In 2023, half of global nickel production was in Indonesia while 73% of global cobalt production was in the Democratic Republic of Congo. Australia and Chile in 2023 produced 65% of the global total of lithium that year, with China taking a further 13% share. Interestingly, according to the World Economic Forum,49 the U.S. was the world’s leading lithium producer up to 1995, with a one-third share of the total.
This degree of concentration might change in due course. However, as the WEO acknowledges, based on the current pipeline of new mining projects, the concentration of mining activity is unlikely to change: “[S]ome 50–75% of supply growth for refined copper, lithium, and cobalt is projected to come from today’s largest producers, and the same is true for about 90% of battery-grade graphite supply and nickel growth” (p. 217).
Figure 14: Global Annual Investments in Fossil Fuels
Flawed Assumption: Oil and gas annual investments are adequate to avoid economic disruptions
There is an inherent tension in the WEO scenarios regarding the future price and availability of oil. On the one hand, scenarios that see oil in excess supply while demand declines point to lower prices, which, in turn, amplify the cost penalties of avoiding oil use. On the other hand, if scenarios see constrained supply with sustained or higher demand, that self-evidently drives prices up and creates economic headwinds, including broad-based inflation. The latter occurs regardless of scenarios since, in the time frames considered, oil continues to have a dominant role in supply chains and transportation across all energy sectors including, and especially, the energy-intensive mining and minerals domains. Without considering a full range of realistic scenarios for future oil supply, there is little credibility for the WEO conclusion that “oil prices in our scenarios act as intermediaries to balance global supply and demand, ensuring markets remain in equilibrium” (p. 90; emphasis added).
All the WEO scenarios, including STEPS, which constitutes the de facto baseline, assume that: a) fossil fuels will be oversupplied even as governments discourage investment; and thus, b) fossil fuels will be available to “bridge” the unreliability of wind/solar; and c) if oversupply happens, the resultant fossil fuel price collapse will apparently have no feedback effect, encouraging greater use. And those conclusions are reached collaterally with the assumption that there will be continued declines in global investment in fossil fuel exploration and infrastructures (see Figure 14).
In STEPS, while oil supply in 2035 is slightly higher than in 2023, the scenario assumes oil demand peaks by 2030, hence putting the world into oversupply. But if, as would be reasonable to model, demand were to continue to grow, then so must supply, which can come only from greater investment to maintain output from current fields and to find new sources of oil. The latter consideration is entirely absent from the NZE scenario, which assumes that no investment in new fields should take place.
The WEO concludes: “Existing and planned fossil fuel infrastructure expansions set to come online over the next ten years should provide some buffer against potential outages and imply downward pressure on prices” (p. 29; emphasis added).
For policymakers and planners, it would be reasonable, even critical, to model the outcome of insufficient supply; a “should provide” conclusion is risky and flawed. A several mmbd shortfall in global oil supply can trigger inflation-inducing, even recession-inducing, price increases, not to mention political panic.
Flawed Assumption: The future decline rate from existing oil fields will continue historical trends
All oil (and natural gas) fields experience a natural decline rate in output. This reality means that major ongoing investments are required to find and develop new oil fields wherein the single most important variable, i.e., assumption, is that decline rate. Nowhere in WEO is this issue discussed. The absence of scenarios with faster decline rates leads to overoptimistic outcomes regarding supply.
The IEA does mention the decline-rate issue in its (separate) medium-term oil report stating that the global average field decline rate is about 5%.50 An alternative view was provided in June 2023 by the Energy Policy Research Foundation, which estimated the global rate to be about 6%, an apparently small difference that nonetheless means 1 mmbd less supply than WEO models.51 Some major producing countries have higher decline rates: Brazil’s burgeoning offshore sector has a 13% decline rate, and the U.S. shale oil fields have an estimated annual decline rate of 28%.
Another significant and credible analysis of decline rates was provided in August 2024 by ExxonMobil. It pointed to a current and forecast overall rate of field decline of 15%.52 Exxon, of course, has significant direct experience with the issue as an operator in many countries and produces about 2.5 mmbd. Exxon concluded that “with no new investment, global oil supplies would fall by more than 15 million barrels per day in the first year alone. At that rate, by 2030, oil supplies would fall from 100 million barrels per day to less than 30 million—that’s 70 million barrels short of what’s needed to meet demand every day.”
Clearly, there will not be a “no new investment” world. However, except for the special case of the U.S. shale sector, investment remains below the 2014 level. This is partly explained by vastly improved discipline in capital and operating expenditures.
A reasonable scenario would reflect the fact that investment in upstream oil and gas is likely to grow, not shrink, in the coming years, given the widespread belief in the international oil industry that demand will not fall sharply in the foreseeable future.
Flawed Assumption: OPEC will be a reliable cushion to manage oil-supply disruptions
An important insurance policy for the supply side of the oil industry is the existence of a very large spare production capacity cushion. It is self-evident that unanticipated events, geopolitical crises, or natural calamities can lead to unexpected losses in global oil supply. The WEO appears, by default, to place a lot of faith in OPEC as the primary supplier of spare oil capacity: “If announced capacity additions by members of the Organization of the Petroleum Exporting Countries (OPEC) proceed, the level of demand growth in the STEPS would mean spare capacity rising to 8 mmbd to 2030” (p. 29).
According to the IEA, members of the OPEC+ oil producers alliance are sitting on 5.6 mmbd of spare production following their decision to cut production to support prices.53 The OPEC+ alliance is composed of members of OPEC (excluding Iran, Venezuela, and Libya) plus Azerbaijan, Bahrain, Brunei, Malaysia, Kazakhstan, Mexico, Oman, Russia, Sudan, and South Sudan. Forecasting oil production policy for the OPEC+ alliance is always difficult.
The spare production cushion conveys huge power to the alliance. Creating a bigger cushion by reducing production is unlikely in the near term. In either case, sensible models would include the impacts of a smaller “cushion.”